
Case Study of Power BI
The healthcare sector’s clinical team is responsible for making outbound calls to customers and addressing their inquiries and issues. However, management in healthcare sectors needs a way to track and monitor the performance of the clinical team in order to ensure that the organization is operating efficiently and effectively. The team’s volume, productivity, and effectiveness, as well as the number of calls made to target groups and customer satisfaction, need to be tracked in order to identify any areas for improvement. Additionally, management needs a way to see these metrics clearly and concisely in order to make informed decisions.
Problems to Solve
- Management at healthcare agencies needs a way to track the clinical team’s performance in order to ensure the organization is operating efficiently.
- Management tracks the number of tickets worked on each month and compares it to the previous month’s data to understand whether the team is meeting goals and targets or if there are areas for improvement.
- Management needs a way to see these metrics clearly and concisely in order to make informed decisions and identify areas for improvement.
- Management also monitors the number of calls made to target groups to understand communication and support with customers and identify any issues to improve the customer experience.
- Management tracks metrics such as volume, productivity, effectiveness, aging, call handling, patient satisfaction, and issue resolution in order to identify areas where the clinical team may be falling short and improve performance
Project Objective
The goal of this project is to improve the performance of the clinical team at healthcare business by tracking key metrics such as volume, productivity, effectiveness, aging, call handling, patient satisfaction, and issue resolution and providing clear and concise visibility into these metrics through a Power BI dashboard. This will enable management to make informed decisions and identify areas for improvement in order to ensure the organization is operating efficiently and effectively.
Tool Selection
By utilizing Microsoft Power BI for advanced analytics for them, the organization is now able to gain clear and concise visibility into the performance of the clinical team through the display of metrics such as volume, productivity, effectiveness, ageing, call handling, patient satisfaction, and issue resolution on a monthly and weekly basis.
After evaluating the options of building analytics in Domo or purchasing a third-party BI solution, Healthcare agency ultimately decided to implement Microsoft Power BI as their chosen advanced analytics solution.
The reason to choose Power BI Embedded was that it was much more flexible, user-friendly, interactive, with intuitive visualizations and efficient than other tools. They integrated Power BI into their working environment quickly.

The Change
- Microsoft Power BI allows the clinical team to track and monitor key metrics such as volume, productivity, effectiveness, aging, call handling, patient satisfaction, and issue resolution on a monthly and weekly basis.
- The Power BI dashboard provides clear and concise visibility into the performance of the clinical team, enabling management to make informed decisions and identify areas for improvement.
- Microsoft Power BI helps management to understand whether the clinical team is on track to meet its goals and targets or if there are areas that need improvement.
- The tool allows management to track and monitor the number of calls made to target groups, helping to understand communication and support with customers and identify any issues to improve the customer experience.
- By tracking metrics such as volume, productivity, effectiveness, aging, call handling, patient satisfaction, and issue resolution, Microsoft Power BI enables management to identify any areas where the clinical team may be falling short and take steps to address and improve those issues.
Understanding the KPI's
Dashboard Implementation
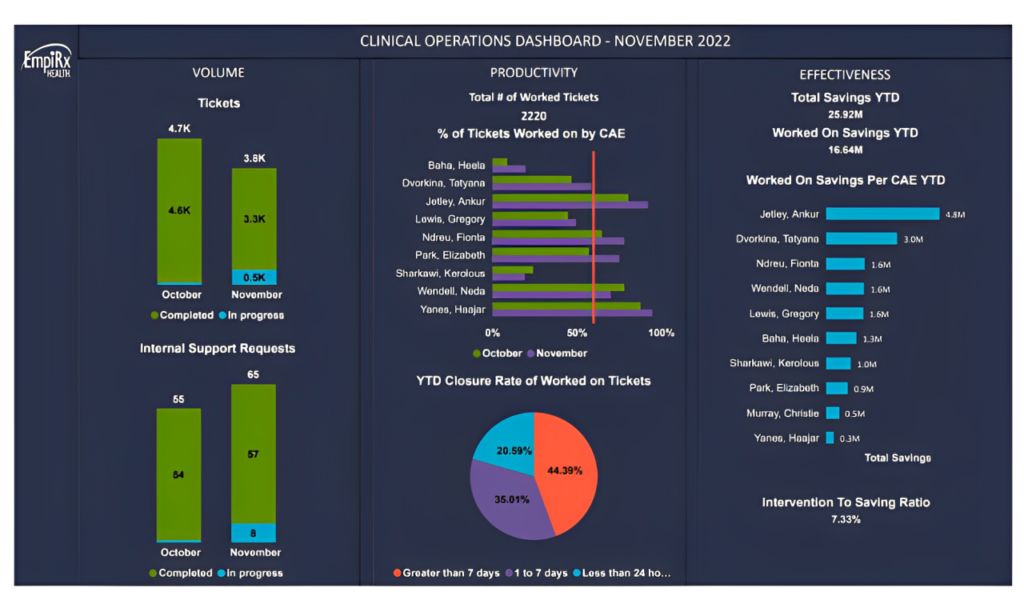
- Tickets, Calls & Internal Support Tasks Volume Analysis: This analysis looks at the volume of tickets, calls, and internal support tasks that the clinical team is responsible for handling. This information can help to understand the workload and demands on the team, and can be compared to previous months or years to track trends and patterns.
- Team Productivity Analysis and Comparison with Last Month: This analysis looks at the productivity of the clinical team, which can be measured in terms of the number of tickets, calls, or tasks completed in a given time period. This analysis also involve comparing the team’s current productivity to that of the previous month to see if there has been any improvement or decline.
- Team Effectiveness in Terms of Savings: This analysis looks at the effectiveness of the clinical team in terms of the financial savings they are able to achieve for the organization. This may involve tracking the cost savings resulting from efficient handling of tickets, calls, and tasks, or from the implementation of process improvements or efficiencies.
- YTD Savings: This metric represents the total savings achieved by the clinical team year-to-date. This information can be useful in understanding the overall financial impact of the team’s activities and performance.
- YTD Closure Rate for Worked on Tickets: This metric represents the percentage of tickets that have been successfully closed by the clinical team year-to-date. A high closure rate may indicate that the team is effectively resolving issues and meeting customer needs.
Monthly Summary: This summary provides an overview of the clinical team’s performance for a given month, including metrics such as Tickets, Aging, Call Handling, Internal Requests and savings.
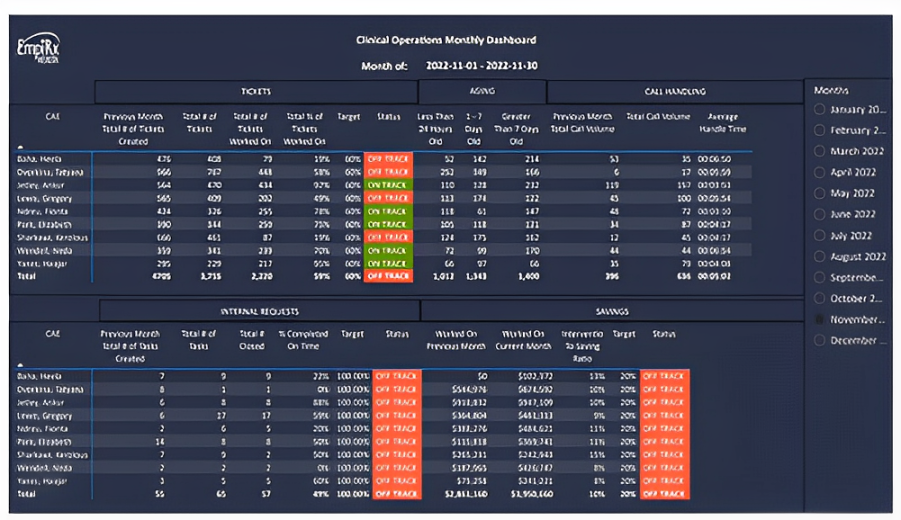
This is performance summary system for each team member that tracks key metrics in relation to ticket management. These metrics include : the number of tickets assigned versus the number of tickets completed, the target number of tickets to be completed within a specified time frame, and an overall performance evaluation. This system allows us to effectively monitor and manage the ticket management performance of each team member.
In addition to ticket management, we have also incorporated other key metrics to evaluate the performance of our team members. These metrics include the number of calls handled, internal requests fulfilled, and savings generated. This comprehensive performance evaluation system allows us to gain a more holistic understanding of our team members’ contributions to the organization and make data-driven decisions to optimize our operations.
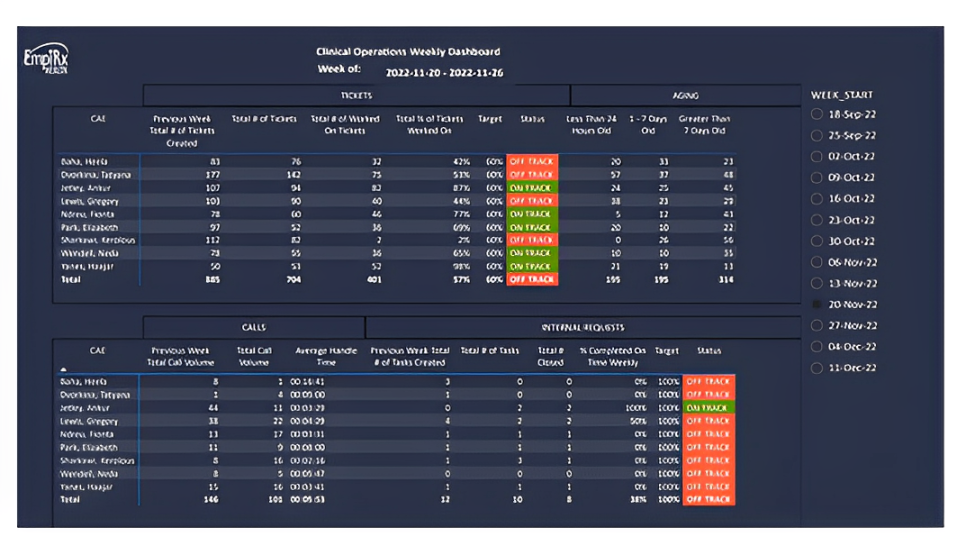
Weekly Summary : This summary provides a more granular view of the clinical team’s performance, breaking down the data into weekly increments rather than monthly. This can help to identify trends or patterns that may not be as apparent when looking at the data on a monthly basis.
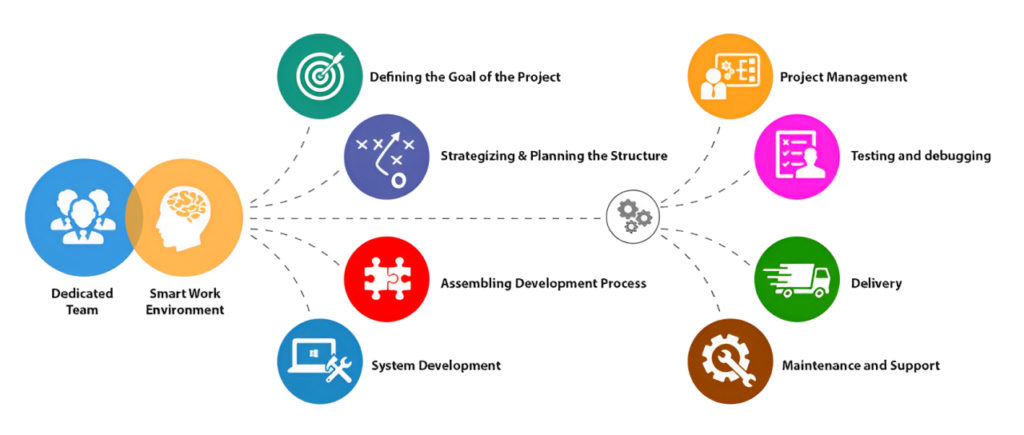
Process
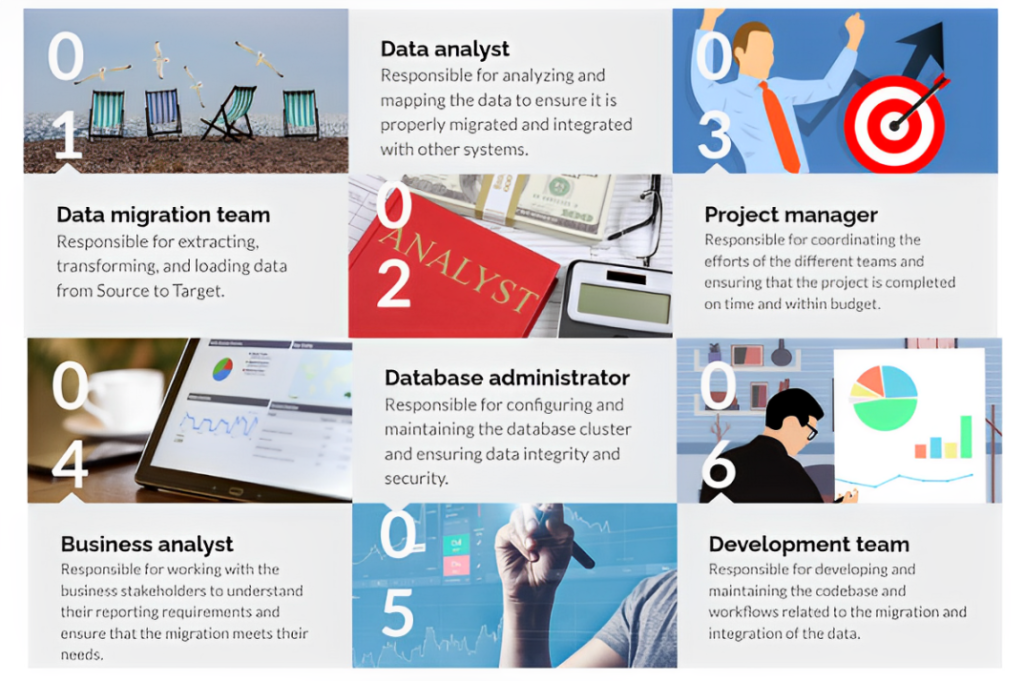
Roles Required
- Data migration team
- Data Analyst
- Project Manager
- Business Analyst
- Database Administrator
- Development Team
Skills Required
- Analyze data from various sources to identify patterns and trends that can inform the development of Power BI dashboards and reports.
- Develop and maintain data models that accurately reflect the relationships and dependencies within the data.
- Collaborate with business stakeholders to understand their reporting requirements and develop solutions that meet their needs.
- Create and implement data connectors to connect the Power BI dashboards to various data sources.
- Develop and implement data cleansing, transformation and migration process to ensure data quality and accuracy.
- Create and maintain data visualization tools, such as dashboards and reports, to help business users understand the data and make decisions.
- Continuously monitor and improve data processing and analysis techniques to ensure that the data is used as efficiently and effectively as possible.
- Create and maintain documentation for the Power BI dashboards, including user guides and training materials.
- Collaborate with IT Operations to ensure that the data is properly integrated with other systems and that it is properly maintained and supported after the migration is complete.
- Troubleshoot and resolve any issues that arise with the Power BI dashboards and reports.